Plane-wave beamforming#
This example demonstrates frequency-domain plane-wave beamforming with the covseisnet.beamforming module. Starting from the UnderVolc array at Piton de la Fournaise, we:
Pre-process the seismograms and estimate the spectral covariance matrix,
Build a slowness grid and pre-compute the inter-station plane-wave delays with
covseisnet.slowness.PlaneWaveDelays,Apply the Bartlett (conventional) beamformer with
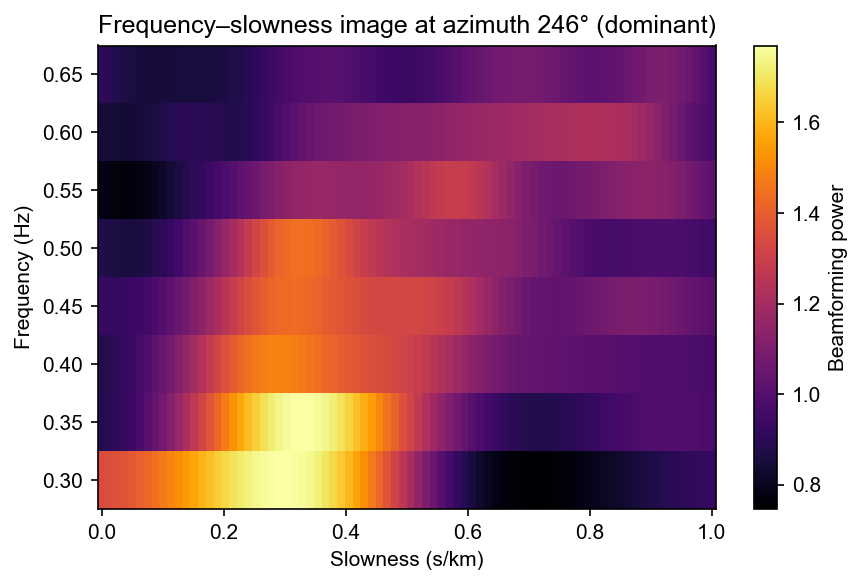
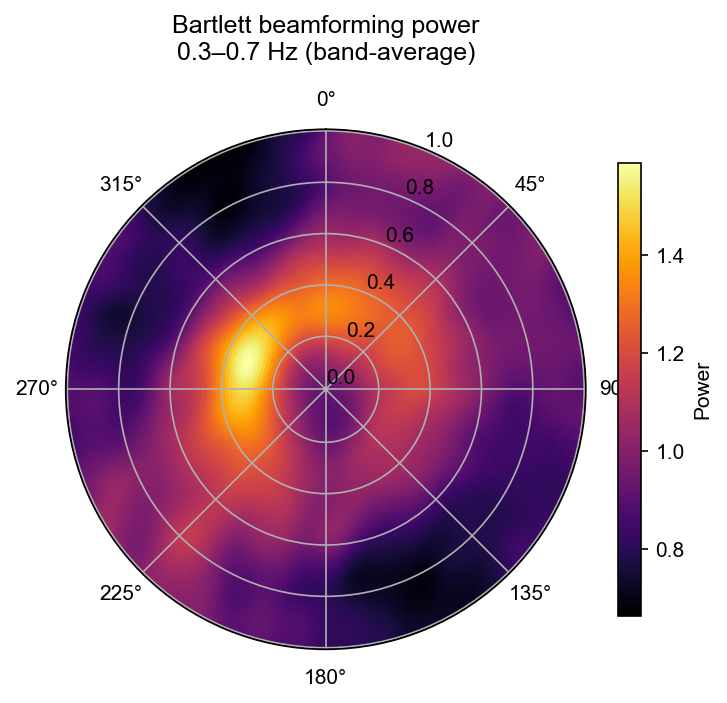
covseisnet.beamforming.PlaneWaveBeamforming.compute_bartlett,Display the beamforming power as a polar diagram and as a frequency–slowness image.
We first validate the method on a synthetic plane-wave covariance, then apply it to the real seismograms.
[7]:
import numpy as np
import matplotlib.pyplot as plt

import covseisnet as csn
from covseisnet.slowness import PlaneWaveDelays
from covseisnet.beamforming import PlaneWaveBeamforming
import covseisnet.synthetic as syn
Station geometry#
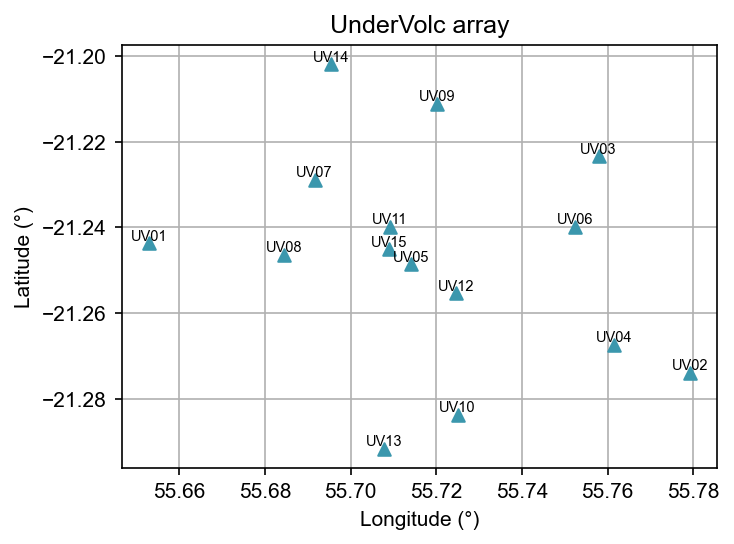
We load the UnderVolc seismograms and attach geographical coordinates. Only the first 200 seconds of data are used to keep the example fast.
[8]:
# Load waveforms and attach station coordinates
stream = csn.read("../data/undervolc.mseed")
stream.assign_coordinates("../data/undervolc.xml")

# Extract stats list
stats = [tr.stats for tr in stream]
n_stations = len(stats)
print(f"Array: {n_stations} stations")

# Quick station map
lons = [s.coordinates["longitude"] for s in stats]
lats = [s.coordinates["latitude"] for s in stats]
fig, ax = plt.subplots(figsize=(5, 4))
ax.scatter(lons, lats, marker="^", zorder=3)
for s in stats:
    ax.annotate(
        s.station,
        (s.coordinates["longitude"], s.coordinates["latitude"]),
        fontsize=7,
        ha="center",
        va="bottom",
    )
ax.set_xlabel("Longitude (°)")
ax.set_ylabel("Latitude (°)")
ax.set_title("UnderVolc array")
ax.set_aspect("equal")
ax.grid()
plt.tight_layout()
Array: 15 stations
Validation on a synthetic plane wave#
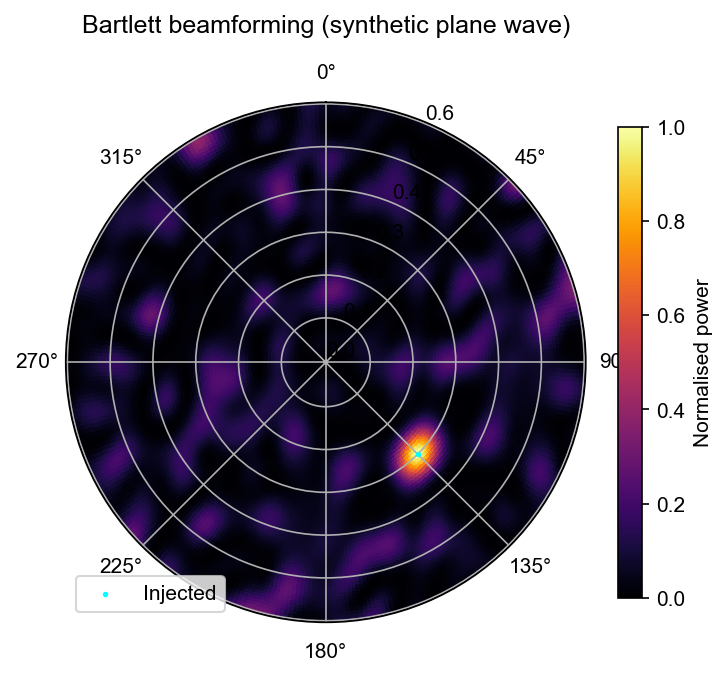
Before applying beamforming to real data we verify that the method correctly recovers the injected slowness and azimuth using a synthetic rank-1 covariance from covseisnet.synthetic.plane_wave_covariance.
[17]:
# Parameters
frequency = 1.0  # Hz
slowness = 0.30  # s/km  (~3.3 km/s)
azimuth = 135.0  # degrees clockwise from North (SE)

# Synthetic rank-1 covariance
cov_plane = syn.plane_wave_covariance(stats, frequency, slowness, azimuth)
cov_plane /= np.abs(cov_plane)

# Slowness grid
delays = PlaneWaveDelays(stats, slowness_max=0.6, n_slowness=80, n_azimuth=360)

# Beamforming
bf = PlaneWaveBeamforming(delays)
bf.compute_bartlett(cov_plane, frequency)

s_det, az_det = bf.maximum_coordinates()
print(f"Injected : slowness = {slowness:.3f} s/km, azimuth = {azimuth:.1f}°")
print(f"Detected : slowness = {s_det:.3f} s/km, azimuth = {az_det:.1f}°")

# Polar plot
S, A = delays.mesh
fig, ax = plt.subplots(subplot_kw={"projection": "polar"}, figsize=(5, 5))
pcm = ax.pcolormesh(
    np.radians(A),
    S,
    bf,
    cmap="inferno",
    shading="auto",
    vmin=0,
    vmax=1,
)
ax.scatter(
    np.radians(azimuth),
    slowness,
    marker=".",
    s=10,
    color="cyan",
    zorder=5,
    label="Injected",
)
ax.set_theta_direction(-1)
ax.set_theta_zero_location("N")
ax.set_title("Bartlett beamforming (synthetic plane wave)", pad=15)
plt.colorbar(pcm, ax=ax, label="Normalised power", shrink=0.7)
ax.legend(loc="lower left")
plt.tight_layout()
Injected : slowness = 0.300 s/km, azimuth = 135.0°
Detected : slowness = 0.296 s/km, azimuth = 135.0°
Spectral covariance from real data#
We estimate the spectral covariance matrix by windowing the data into overlapping segments of 20 s, applying spectral whitening, and averaging over all windows. This yields a single covariance matrix as a function of frequency, representative of the ambient noise field recorded by the array.
[18]:
# Normalise and filter before covariance estimation
stream.detrend("linear")
stream.filter("bandpass", freqmin=0.5, freqmax=10.0)

# Covariance matrix
times, frequencies, covariances = csn.calculate_covariance_matrix(
    stream, window_duration=20, average=10, whiten="slice"
)

# Average over time to get a single N×N matrix per frequency
cov_mean = covariances.mean(axis=0)
print(f"Covariance shape: {cov_mean.shape}  (n_freq × N × N)")
/Users/seydoux/GitHub/covseisnet/.venv/lib/python3.13/site-packages/obspy/signal/filter.py:62: UserWarning: Selected high corner frequency (10.0) of bandpass is at or above Nyquist (10.0). Applying a high-pass instead.
  warnings.warn(msg)
Covariance shape: (201, 15, 15) (n_freq × N × N)
Beamforming power as a function of frequency#
We apply the Bartlett beamformer at every frequency bin and accumulate the result into a frequency–slowness–azimuth cube. We then visualise:
The polar diagram (azimuth × slowness) integrated over a 1–4 Hz band, showing the dominant propagation direction of the ambient wavefield.
The frequency–slowness image at the dominant azimuth.
[23]:
# Reuse the same delay grid
delays = PlaneWaveDelays(stats, slowness_max=1, n_slowness=80, n_azimuth=360)

# Frequency band for integration
fmin, fmax = 0.3, 0.7
freq_mask = (frequencies >= fmin) & (frequencies <= fmax)

# Accumulate beamforming power over the chosen frequency band
bf_stack = np.zeros(delays.shape)
n_freq = 0
for f, cov_f in zip(frequencies[freq_mask], cov_mean[freq_mask]):
    bf = PlaneWaveBeamforming(delays)
    bf.compute_bartlett(cov_f, f)
    bf_stack += np.nan_to_num(bf)
    n_freq += 1
bf_stack /= n_freq

# ---- Polar diagram (band-integrated) ----
S, A = delays.mesh
fig, ax = plt.subplots(subplot_kw={"projection": "polar"}, figsize=(5, 5))
pcm = ax.pcolormesh(
    np.radians(A),
    S,
    bf_stack,
    cmap="inferno",
    shading="auto",
)
ax.set_theta_direction(-1)
ax.set_theta_zero_location("N")
ax.set_title(
    f"Bartlett beamforming power\n{fmin}–{fmax} Hz (band-average)", pad=15
)
plt.colorbar(pcm, ax=ax, label="Power", shrink=0.7)
plt.tight_layout()
[24]:
# ---- Frequency–slowness image at the dominant azimuth ----
i_az_max = np.argmax(bf_stack.sum(axis=0))
az_dominant = delays.azimuth[i_az_max]

# Build the frequency–slowness matrix
fs_image = np.zeros((freq_mask.sum(), len(delays.slowness)))
for i_f, (f, cov_f) in enumerate(
    zip(frequencies[freq_mask], cov_mean[freq_mask])
):
    bf_f = PlaneWaveBeamforming(delays)
    bf_f.compute_bartlett(cov_f, f)
    fs_image[i_f] = bf_f[:, i_az_max]

fig, ax = plt.subplots(figsize=(6, 4))
pcm = ax.pcolormesh(
    delays.slowness,
    frequencies[freq_mask],
    fs_image,
    cmap="inferno",
    shading="auto",
)
ax.set_xlabel("Slowness (s/km)")
ax.set_ylabel("Frequency (Hz)")
ax.set_title(
    f"Frequency–slowness image at azimuth {az_dominant:.0f}° (dominant)"
)
plt.colorbar(pcm, ax=ax, label="Beamforming power")
plt.tight_layout()